Measuring Moods: Signals for Insight into Emotion

“Do you ever look at someone and wonder what is going on inside their head?”

Joy, an anthropomorphized manifestation of happiness, delivers this line at the opening of Pixar’s 2015 animated hit “Inside Out,” a film that explores the emotional struggles of its young protagonist. She could have been speaking for generations of researchers who have plumbed the depths of the human psyche for a better understanding of the mechanisms behind our feelings, moods, and emotions.

When today’s researchers talk about emotion, they typically do so in terms of affect, the underlying physiological and psychological experience of feelings and emotions as a reaction to stimuli. Affect and emotion are not the same thing, per se, but are fundamentally connected. While the feelings we describe as fear, joy, love, hate, etc. remain abstract, affect is more concrete. BIOPAC co-founder and head of R&D describes it as “the measurable quality or manifestation of emotion in the human body.”

This manifestation can be measured in the human nervous system’s response to stimuli. Depending on the nature of the stimuli and how this sensory data is interpreted by the central nervous system, an array of physiological responses can take place: heart rate changes, the stomach and muscle groups tense, skin temperature responds, triggering sweat glands, among others.

The signals corresponding to these reactions provide researchers with valuable data to help them better understand affect and emotion. These signals—electroencephalogram (EEG), electrodermal activity (EDA), electromyogram (EMG), heart rate, and respiratory rate, to name a few—can be recorded and measured using a range of currently available sensing technologies.

As an example, a 2019 study published through the Queensland University of Technology used respiration signals as a means of classification for human emotions such as happiness, sadness, surprise, disgust, fear, and anger. In the study, breathing signals, including airflow rate and volume, were acquired and recorded using a BIOPAC MP36 data acquisition unit while participants were shown seven film clips, each associated with a different emotion. The study concluded that the respiratory data was 80% effective in accurately classifying affective responses to the film stimuli.

A team of researchers at the Khwaja Fareed University of Engineering and Information Technology in Pakistan took their investigation into the connection between physiological signals and emotion a step further. They used a similar approach by measuring participant response to movie clips, however this time, four types of physiological signals were acquired, including ECG, EMG, respiration, and skin conductivity (SC). The data was acquired with a wide range of signal sensors and analyzed via a BIOPAC MP160 DAQ System.Signals for Emotion

Signal sensing technology also allows researchers to study emotion in multiple participants simultaneously, as was the case in a 2020 dyadic study of how a parent’s stress and emotional suppression affects their children. The study measured physiological responses of both parents and children using ECG and impedance cardiography (ICG) via a BIOPAC MP150 data acquisition unit.

The mysteries of human emotion are being unlocked through a growing understanding of the affective response to stimuli. For more information on how physiological signals can be gathered and analyzed for this purpose, see our app note on emotional state physiology as well as our webinar Emotion and Objective Physiological Measures.


Contact BIOPAC for the latest information on how we can help you measure affect in the lab.

Baby Blues: Neonatal, Infant, and Toddler Research Challenges

The first five years of a child’s life are marked by considerable change—both physiological and psychological. Young children undergo incremental development in their ability to think and solve problems, their emotions, and their linguistic abilities, to name just a few developmental changes. Over time, the rapidity and extent of this development vary by individual, even among children of the same age. For these reasons, research techniques and tools must be adopted that are suitable for the participant’s age group. In this constantly evolving segment of the physiological and psychophysiological field, new approaches and technologies are being implemented with the needs of our youngest participants in mind.

Different Needs, New Approaches

A recent article published by researchers at the University of California Irvine outlined some of the challenges in conducting research within the neonatal to toddler age groups. Chief among these was the higher levels of attrition among these groups compared to older test subjects. Much of this can be linked to the general characteristics of the test group—reduced ability to sit still for long periods of time, shorter attention span, and lack of motivation to participate. While these factors may not surprise an experienced parent or childcare provider, they can throw a wrench into any study that has not taken such challenges into account.

Tools for Toddlers

Choosing the right tools and applying them appropriately in the lab setting can not only significantly improve attrition rates, but also the quality of data. Receiving a clear, uninterrupted signal when gathering data from a research participant is challenging under the best of conditions and can seem insurmountable when it involves a potentially fussy, fidgety young child or infant. Thankfully, research tools and technologies have been developed with our youngest participants in mind. These include electrodes for infants that are not only sized appropriately but also designed not to irritate sensitive skin, as well as infant-sized EEG caps that are comfortable enough to be worn for extended periods and secure to prevent excess movement and signal loss.

Combining Technique with Technology

Dyadic ResearchSome researchers have found the best approach to tackling the challenges presented by these youngest participants is a combination of age-appropriate strategies and specialized equipment. A 2020 dyadic study published in the Journal of Cognitive Neuroscience examined the Effects of Maternal Singing Style on Mother-Infant Arousal and Behavior by using skin conductance (SC) levels as a measure of arousal in both the mother and infant participants. Both participants were fitted with pre-gelled electrodes attached to BioNomadix wireless EDA transmitters, which are less cumbersome than a fully wired solution. While the mother’s electrodes were attached at the neck, the infants were attached to the foot and secured in place with paper medical tape and covered with a sock. This ensured the electrodes would be held securely in place and reduce movement that could negatively impact signal quality.

We have only scratched the surface of the tools and strategies available for conducting lab research on very young participants. For additional information, watch our webinar on Research and Best Practices for Recording from Newborns, Infants, and Toddlers.


For additional information on research tools for young participants, contact your local BIOPAC sales representative.

Choosing the Right Signal: Easy as 1, 2, 3

In physiology and life sciences, researchers rely on a wide range of signals to gather data from humans and animals. These signals provide critical insight into how complex organisms function under a myriad of conditions. However, this wealth of potential data sources can also present a challenge for researchers: choosing the right signals on which to focus their data gathering. For those lacking a background in the disciplines and mechanisms behind these signals, sifting through the available methodology can be overwhelming. The best place to begin is by considering one or a combination of the “Big Three” physiological signals: ECG, EDA, and respiration.

In physiology and life sciences, researchers rely on a wide range of signals to gather data from humans and animals. These signals provide critical insight into how complex organisms function under a myriad of conditions. However, this wealth of potential data sources can also present a challenge for researchers: choosing the right signals on which to focus their data gathering. For those lacking a background in the disciplines and mechanisms behind these signals, sifting through the available methodology can be overwhelming. The best place to begin is by considering one or a combination of the “Big Three” physiological signals: ECG, EDA, and respiration.

One from the Heart

Changes in heart rate can provide information on both the physiological and psychological state of a research participant. Electrocardiography (ECG or EKG) is a biopotential measurement that provides direct metrics on electrical voltage changes in the heart. With the help of simple hardware and software, it is possible to record these voltage variations as waveforms to track how the heart responds to stimuli. Additional data can be provided by creating reoccurring reference points in the waveform, measuring the intervals between beats, and calculating heart rate variability to track changes over time or in response to stimuli.

Skin Deep

Electrodermal Activity (EDA) provides one of the best measurements of how the body responds to psychological stress and anxiety. It can be simply understood as a measure of changes in the electrical conductance of the skin in relation to the production of sweat. The physiological process of EDA comprises two components, skin conductance level (SCL) and skin conductance response (SCR). SCL is a tonic level that slowly changes over time, measuring the period for response to a stimulus to occur, from its onset to its peak. SCR reflects the phasic response to an arousing stimulus that is shown in faster changes of the skin conductance level. As an example of the application of EDA and ECG measurements in psycho-physiological research, a recent study applied both signals in measuring the cognitive states of gamers during human-computer interaction (HCI).

Breathe Easy

ArachnophobiaAs with changes in heart rate, variations in breathing cycle reveal how subjects respond to a wide range of stimuli and conditions. The signal produced by the respiratory cycle is a transduced physiological signal. As such we can apply mechanisms to create a voltage potential to measure phases of inhalation and exhalation in this cycle. This data can be represented in waveforms, providing data on respiratory rate, amplitude, and respiratory sinus arrhythmia (RSA). The latter combines respiratory data with ECG signal data to show changes in heart rate in response phases in the respiratory cycle. A 2020 machine learning study for the development of virtual reality applications combined respiration, EDA, and ECG signals to measure participant’s fear response to spiders, an example of how all three signals can be simultaneously utilized in psychophysiology research.

Choosing the right signal shouldn’t be the biggest hurdle to designing your next research project. Applying one or more of these “Big Three” can cover a wide range of data gathering goals.


For additional assistance, consult BIOPACS online resources on Life Science and Physiological Signals or contact your local BIOPAC representative.

The Right Tools: Streamlining Stimulus Presentation

Our nervous system processes information from a dizzying array of stimuli—visual, auditory, thermal, olfactory, and tactile, among others. How organisms respond to stimuli provides researchers with a wealth of information on how they adapt, learn, and live. The complex interaction between stimulus and response presents a myriad of challenges when it comes to creating effective stimuli in the research environment and accurately gathering data from subjects.

Today’s researchers have been gifted with a variety of stimulus presentation options to suit their individual needs. Complex experiments may call for robust solutions that integrate a wide range of stimulus presentation and data acquisition hardware and software, often from various industry leading manufacturers such as BIOPAC, E-Prime, and Cedrus. Such experiments can combine multiple stimuli with advanced stimulus controls and data gathering techniques.

Stimulus presentation, however, is not a one-size-fits-all proposition and some researchers may prefer a simpler solution that integrates visual stimulation presentation tools with powerful eye-tracking, as is available with BIOPAC’s screen-based Eye Tracking system. Additionally, AcqKnowledge now offers native integration and synchronization of stimulus presentation, eye tracking, and physiology data acquisition and analysis, all easily managed from a single application.

The seamless integration of stimulus presentation in data gathering and analysis allowed a team of researchers from the University of Connecticut and Emory University to monitor electrodermal activity (EDA) in subjects as they responded to pain stimuli induced by electrothermal grills. The goal of the study was to determine the viability of using such grills to induce pain without causing physical harm to research subjects. Researchers recorded and stored EDA signals from electrodes attached to the subjects’ fingers with a BioNomadix® wireless amplifier and MP160 data acquisition device connected to a computer running AcqKnowledge. A STMISOC programmable stimulus isolation adapter provided EP stimulation, allowing software-controlled adjustment of stimulus pulse width, repetition, and setup of an arbitrary pulse stimulus sequence via AcqKnowledge.

Using a single integrated system doesn’t necessarily equate sacrificing utility, nor does cross-platform integration need to be complicated. A group of researchers in Beijing recently explored the connection between fear response, conditioning, and memory that required the application of electrical shocks of varying intensity. A constant current STM200 stimulator delivered the shocks, in this case controlled by E-Prime software while data was collected by an MP150 running AcqKnowledge. In its current build, AcqKnowledge also integrates stimulus presentation and data acquisition, potentially streamlining the design of such an experiment.

Scent deliveryStudies requiring the simultaneous introduction of multiple stimuli can raise the level of complexity for researchers, as it did in a recent study that examined a link between pleasant touch and scent with facial muscle activity and heart rate. Facial EMG and ECG data were collected using a BIOPAC MP Research System with a BioNomadix® wireless system connected to a computer running AcqKnowledge; current builds of the software provide full integration of scent delivery hardware.

BIOPAC’s new integrated stimulus presentation meshes seamlessly with Eye Tracking and data acquisition, providing researchers with an integrated solution to save valuable time and effort.


BIOPAC Systems, Inc. provides life science researchers and educators with data acquisition and analysis systems that inspire people and enable greater discovery about life.

Scaling Up: The Challenges of Large-Group Studies

When formulating an approach to a research study, planning experiments, and choosing the right technology for the job, size matters. Research studies with human subjects generally fall into three scale-related categories: individual, small-group, and large-group studies. When we discuss “size” in this context, we are talking about the number of subjects sampled together at one time and in one location.

Single-participant studies sample data from subjects separately while dyadic research gathers input from two subjects at the same time and place. It may be necessary, however, to take readings from three, four, or dozens of study subject simultaneously. In such cases, researchers often want to measure how the participants react to identical stimuli or the same external conditions such as those found in a classroom, courtroom, or theater setting. Researchers may also seek to measure how subjects react or interact with other members of the study group such as during business exchanges, in a meeting room environment, or in game sessions or other competitive settings.

These large-group studies present critical challenges that may not normally occur in single-participant studies. First, the stimuli to which the participants respond must be presented in a uniform and synchronous manner. Whether the stimuli are visual or auditory, thermal or olfactory, electrical or haptic, all study subjects must be able to respond to the same stimulus.

A recent study in behavioral economics measured psychophysiological reactions to various stimuli in the form of market and trading games in which multiple interactions took place between a set of “players.” Timing was critical to accurately measure the participants’ physiological responses to trades, losses, and gains. Both the presentation of stimuli and the recording of the participants’ reactions had to be precisely synchronized.

Methods for recording subjects’ response may include biopotential data such as ECG/EKG, EEG, EMG; transducer signals that can include electrodermal activity (EDA), respiration, and temperature; eye tracking; video recording; subjective response; or fNIRS, to name just a few examples. In the above study, participants were equipped with a photodiode that recorded responses during a decision-making experiment. Signals from the photodiodes were transmitted to a 16-channel BIOPAC MP150 Data Acquisition System (since replaced by the MP160 Data Acquisition System), allowing the simultaneous, synchronous recording of timing data from up to 16 subjects.

Child StudiesSynchronizing data is just one consideration when conducting multi-participant studies. Other logistical challenges arise when participants must interact with their surroundings. Another large-group study compared physical and psychological activity among seven-year-old elementary school children as they learned geometry through movement-based teaching methods. This presented several challenges, including the age of the subjects and the need for freedom of movement. Such problems are common to large-group studies that require multiple participants to move unimpeded by recording apparatuses. Typically, a researcher will choose between either a minimally invasive tethered device that can be wired to a data acquisition unit (e.g., BIOPAC ECG100D Smart Amplifier) or a wireless device (e.g., BIOPAC BN-ECG2 Wireless ECG Amplifier) that permits additional freedom of movement. In this study, the researchers used wearable devices to record the children’s energy expenditure, intensity of movements, EDA, body heat flux, and skin temperature.

While large-group studies present an array of unique challenges to gathering data, these challenges can be overcome through careful planning and by choosing the right tools for the job. BIOPAC offers a wide range of scalable technologies, software, and accessories for conducting research with individual subjects, pairs, or large groups that can be adapted to an array of scenarios and research settings.

T4 Conference Wrap-up

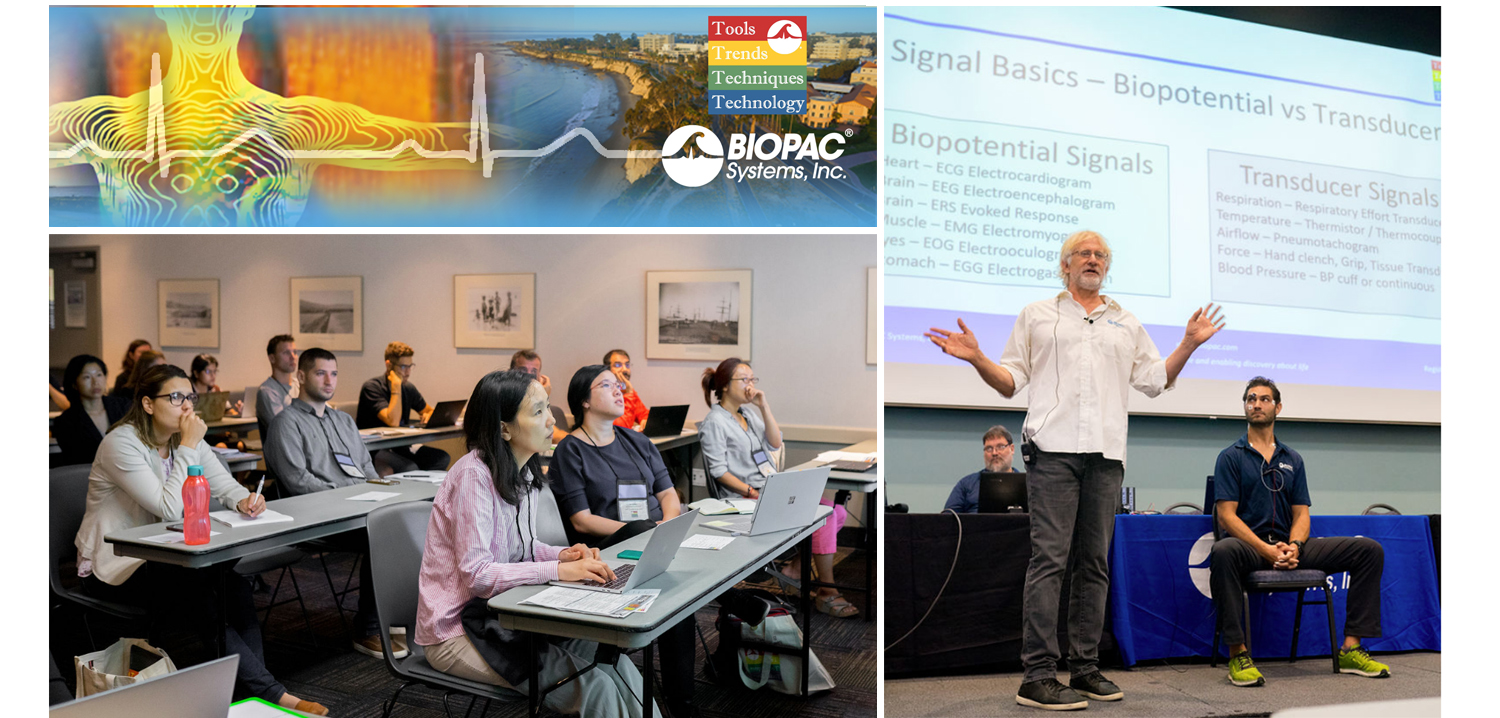
August is a month of barbecues, baseball, and last-minute vacations against the backdrop of a fading summer, and the eighth month of 2019 proved to be an equally exciting time at BIOPAC, with something of a pleasant vacation thrown in. On August 12-14, BIOPAC hosted its 2nd Biennial “Tools, Trends, Techniques, and Technology” Human Physiology Conference, known as “T4” to our friends and partners around the world. This three-day event, first held in 2017, featured lively, informative sessions hosted by BIOPAC staff, partners, noted academics, and industry experts, and covered a wide range of physiological techniques and disciplines. Over 150 attendees joined BIOPAC at the 2019 T4 Conference staged once again at the beautiful University of California at Santa Barbara campus. Participants and instructors winged in from China, Australia, Germany, Sweden, Italy, Spain, U.K., Ireland, and Egypt, as well as from wide regions of the U.S and Canada to soak up the idyllic surroundings of this ocean-side campus.

The focus of BIOPAC’s T4 Conference was to provide a fun, relaxed environment while hosting nearly 40 hands-on, human physiology training workshops chaired by over 20 distinguished instructors from around the globe. One of the many conference highlights was the “Mindfulness, Meditation, and Measurement: Mindfulness Exercises in Physiological Monitoring” session, hosted by Dr. Allan Weiss of the University of Southern California and  BIOPAC Co-founder and Director of R & D Alan Macy. These sessions, conducted in two parts over a two day period were booked beyond capacity, even though the early morning fog hadn’t yet lifted from the campus skyline.

The varied additional sessions covered a range from the basics, “Setting Up Your Lab, Getting Great Data and Troubleshooting,” (hosted by Dr. Terry Blumenthal of Wake Forest University, and BIOPAC’s Alan Macy and Tim Cook), and “Creating Your Own Lessons Using BSL PRO,” (hosted by Dr. Taffeta Elliot of the New Mexico Institute of Mining and Technology), to exciting new technologies such as “Integrating Screen-based Eye Trackers with AcqKnowledge,” with Keith Jackson of BIOPAC partner company EyeTech, BIOPAC CEO Frazer Findlay, and BIOPAC Engineering Manager Ed Peterlin. Additional wide-ranging physiological disciplines were also covered, including MRI techniques, stimulation, and exercise physiology. All sessions were conducted using BIOPAC hardware and software systems, as well as platforms provided by BIOPAC partners such as Cedrus, fNIR, WorldViz, Psychology Software Tools, and CNSystems. At the end of each day, it was time to relax and unwind with a beverage of choice, a a walk along the beach, and some good conversation. Each evening featured excellent meals and camaraderie in the relaxed yet elegant environment of some of Santa Barbara and Goleta’s most stunning surroundings. After three great days of immersive sessions, it came time for everyone to part ways, having forged new collaborative partnerships and an enhanced knowledge about the full potential of BIOPAC and BIOPAC partner products.

You don’t have to wait for T4 2021 to learn more about life science data—watch Fundamentals of Physiological Data Recording now!

For a closer look at T4, and a preview of what is sure to be an exciting 2021 event, we invite you to visit our T4 Human Physiology Conference page.

Looking for additional resources, tips, tricks, and expert advice on BIOPAC and BIOPAC Partner products? Please also visit our Webinars and Video Tutorial pages.


BIOPAC offers a wide array of wired and wireless equipment that can be used in your research. To find more information on solutions for recording and analyzing signals such as ECG, heart rate, respiration and more using any platforms mentioned in this blog post, you can visit the individual application pages on the BIOPAC website.

Best Practices for Recording & Analyzing Data

Over the past several years, tools and techniques for recording and analyzing physiological data recording have seen steady and marked improvement. Modern life science data acquisition systems such as the MP160 System and powerful research-grade software suites such as AcqKnowledge bring high-end physiology tools within reach of the smallest lab. Even with continuing advances and reduced margin for error, it remains prudent to follow some fundamental guidelines for maximizing data quality and clarity.

Preparation is important. First, invest time exploring the system if it’s new or unfamiliar. An overview of the documentation, training videos, and available webinars, as well as some practice runs with the hardware and software will save time and effort when the time comes to conduct a study. This will also build proficiency at identifying the differences between good and poor data.

Next, familiarize yourself with the type of electrodes and/or transducers necessary for the physiological signals you will be acquiring, which includes proper electrode and skin site preparation. For example, gently abrading the skin prior to applying electrodes is normally recommended for most signal types, except for electrodermal activity (EDA), in which case it’s vital to NOT abrade the skin beforehand. It is also helpful to wait at least 5 minutes before starting a recording, which enables the electrode gel to be absorbed into the skin, helping reduce the impedance.

Performing an impedance check to ensure that the electrodes are making good contact with the skin is also highly recommended. This task is made easier by using an Electrode Impedance Checker (such as EL-CHECK), a simple device for quickly measuring the resistance between the skin and the electrode that provides an LED readout of the skin/electrode contact quality. If the resistance is too high (indicating poor contact) proper adjustments can be made before starting an experiment.

For certain signal types, excessive participant movement can introduce unwanted artifact into the signal, resulting in poor or skewed data. Make sure the participant remains as still as possible during studies involving these signals. Using tape to attach the electrode leads to the skin and keep them from moving excessively can also be helpful.

A thorough check of the system and all connections, cameras, and other hardware is important, so that any problems with equipment or setup can be addressed in advance, thus avoiding a show-stopping issue in the midst of an experiment. This would include performing a pilot study with trained personnel in order to head off any unforeseen issues with the data collection.

Creating a lab setup conducive to a relaxed environment for the participant and technician alike will yield better results. This means eliminating clutter, noise, and other distractions that can affect comfort and attention span. Some labs even avoid having their staff wear lab coats because this can heighten participant nervousness.

Keeping detailed notes on successful lab setups is also helpful and will streamline the preparation process for future experiments. Additionally, creating and saving graph templates for regularly-repeated experiments will save further time and effort.

For more about the fundamentals of recording great data, we invite you to view this free on-demand webinar Fundamentals of Physiology Recording.


BIOPAC offers a wide array of wired and wireless equipment that can be used in your research. To find more information on solutions for recording and analyzing signals such as ECG, heart rate, respiration and more using any platforms mentioned in this blog post, you can visit the individual application pages on the BIOPAC website.

Photo by John Schnobrich on Unsplash

Why Smart Technology Is Smarter

Physiological research studies require a great deal of focused expertise, including an ability to properly set up all necessary equipment for the study at hand. This has long consisted of overseeing a host of manual hardware connections and software settings, and mistakes can be frustrating. The good news is most users become proficient at these detailed configurations, but wouldn’t it be a welcome change if these setups were easier? Think about how helpful it would be if the hardware and software were “smarter” and actively worked on your behalf. This is now a reality with the smart technology offered by BIOPAC’s newly-released line of 100D Smart Amplifiers.

What is smart technology and what makes Smart Amplifiers smarter? To begin with, these amplifiers are significantly smaller than standard amplifiers (only 4.6 mm in length) and have no buttons or switches. The convenient lightweight design is a powerful benefit, enabling these amplifiers to be attached closer to the participant’s body. Because the amp itself is positioned near the signal source(via a lightweight 3-meter cable), the resulting data is of superbly high quality, with less noise and artifact than conventional amplifiers. But let’s get to the smart part. The smart technology in Smart Amplifiers enables them to do the setup work for you. Each Smart Amplifier, regardless of signal type,  self-configures to the optimally recommended settings, negating the need for user-defined adjustments or monitoring of physical switch positions. Simply plug the amplifier into the new AMI100D Input Module now included with every BIOPAC MP160 System, launch the AcqKnowledge software, and begin recording data.

To minimize setup time and errors in the lab, Smart Amplifiers utilize auto-detection and auto-identification technology. Not only do they self-configure, they also alert you (via a software dialog) whether the amplifier is connected to the correct channel. So basically, using Smart Amplifiers right out of the box is a three step process. 1) connect the amplifiers, 2) select any desired calculation channels for derived signals, 3) click Record. That’s it.

Frequently-used calculation channels or transformations are pre-configured for all signals and can be enabled by simply checking a box in the amplifier’s software UI. (For example, the ECG100D Smart Amplifier offers options to add heart rate and/or R-R interval, and will automatically place these derived signals in a separate calculation channel in the AcqKnowledge graph.)

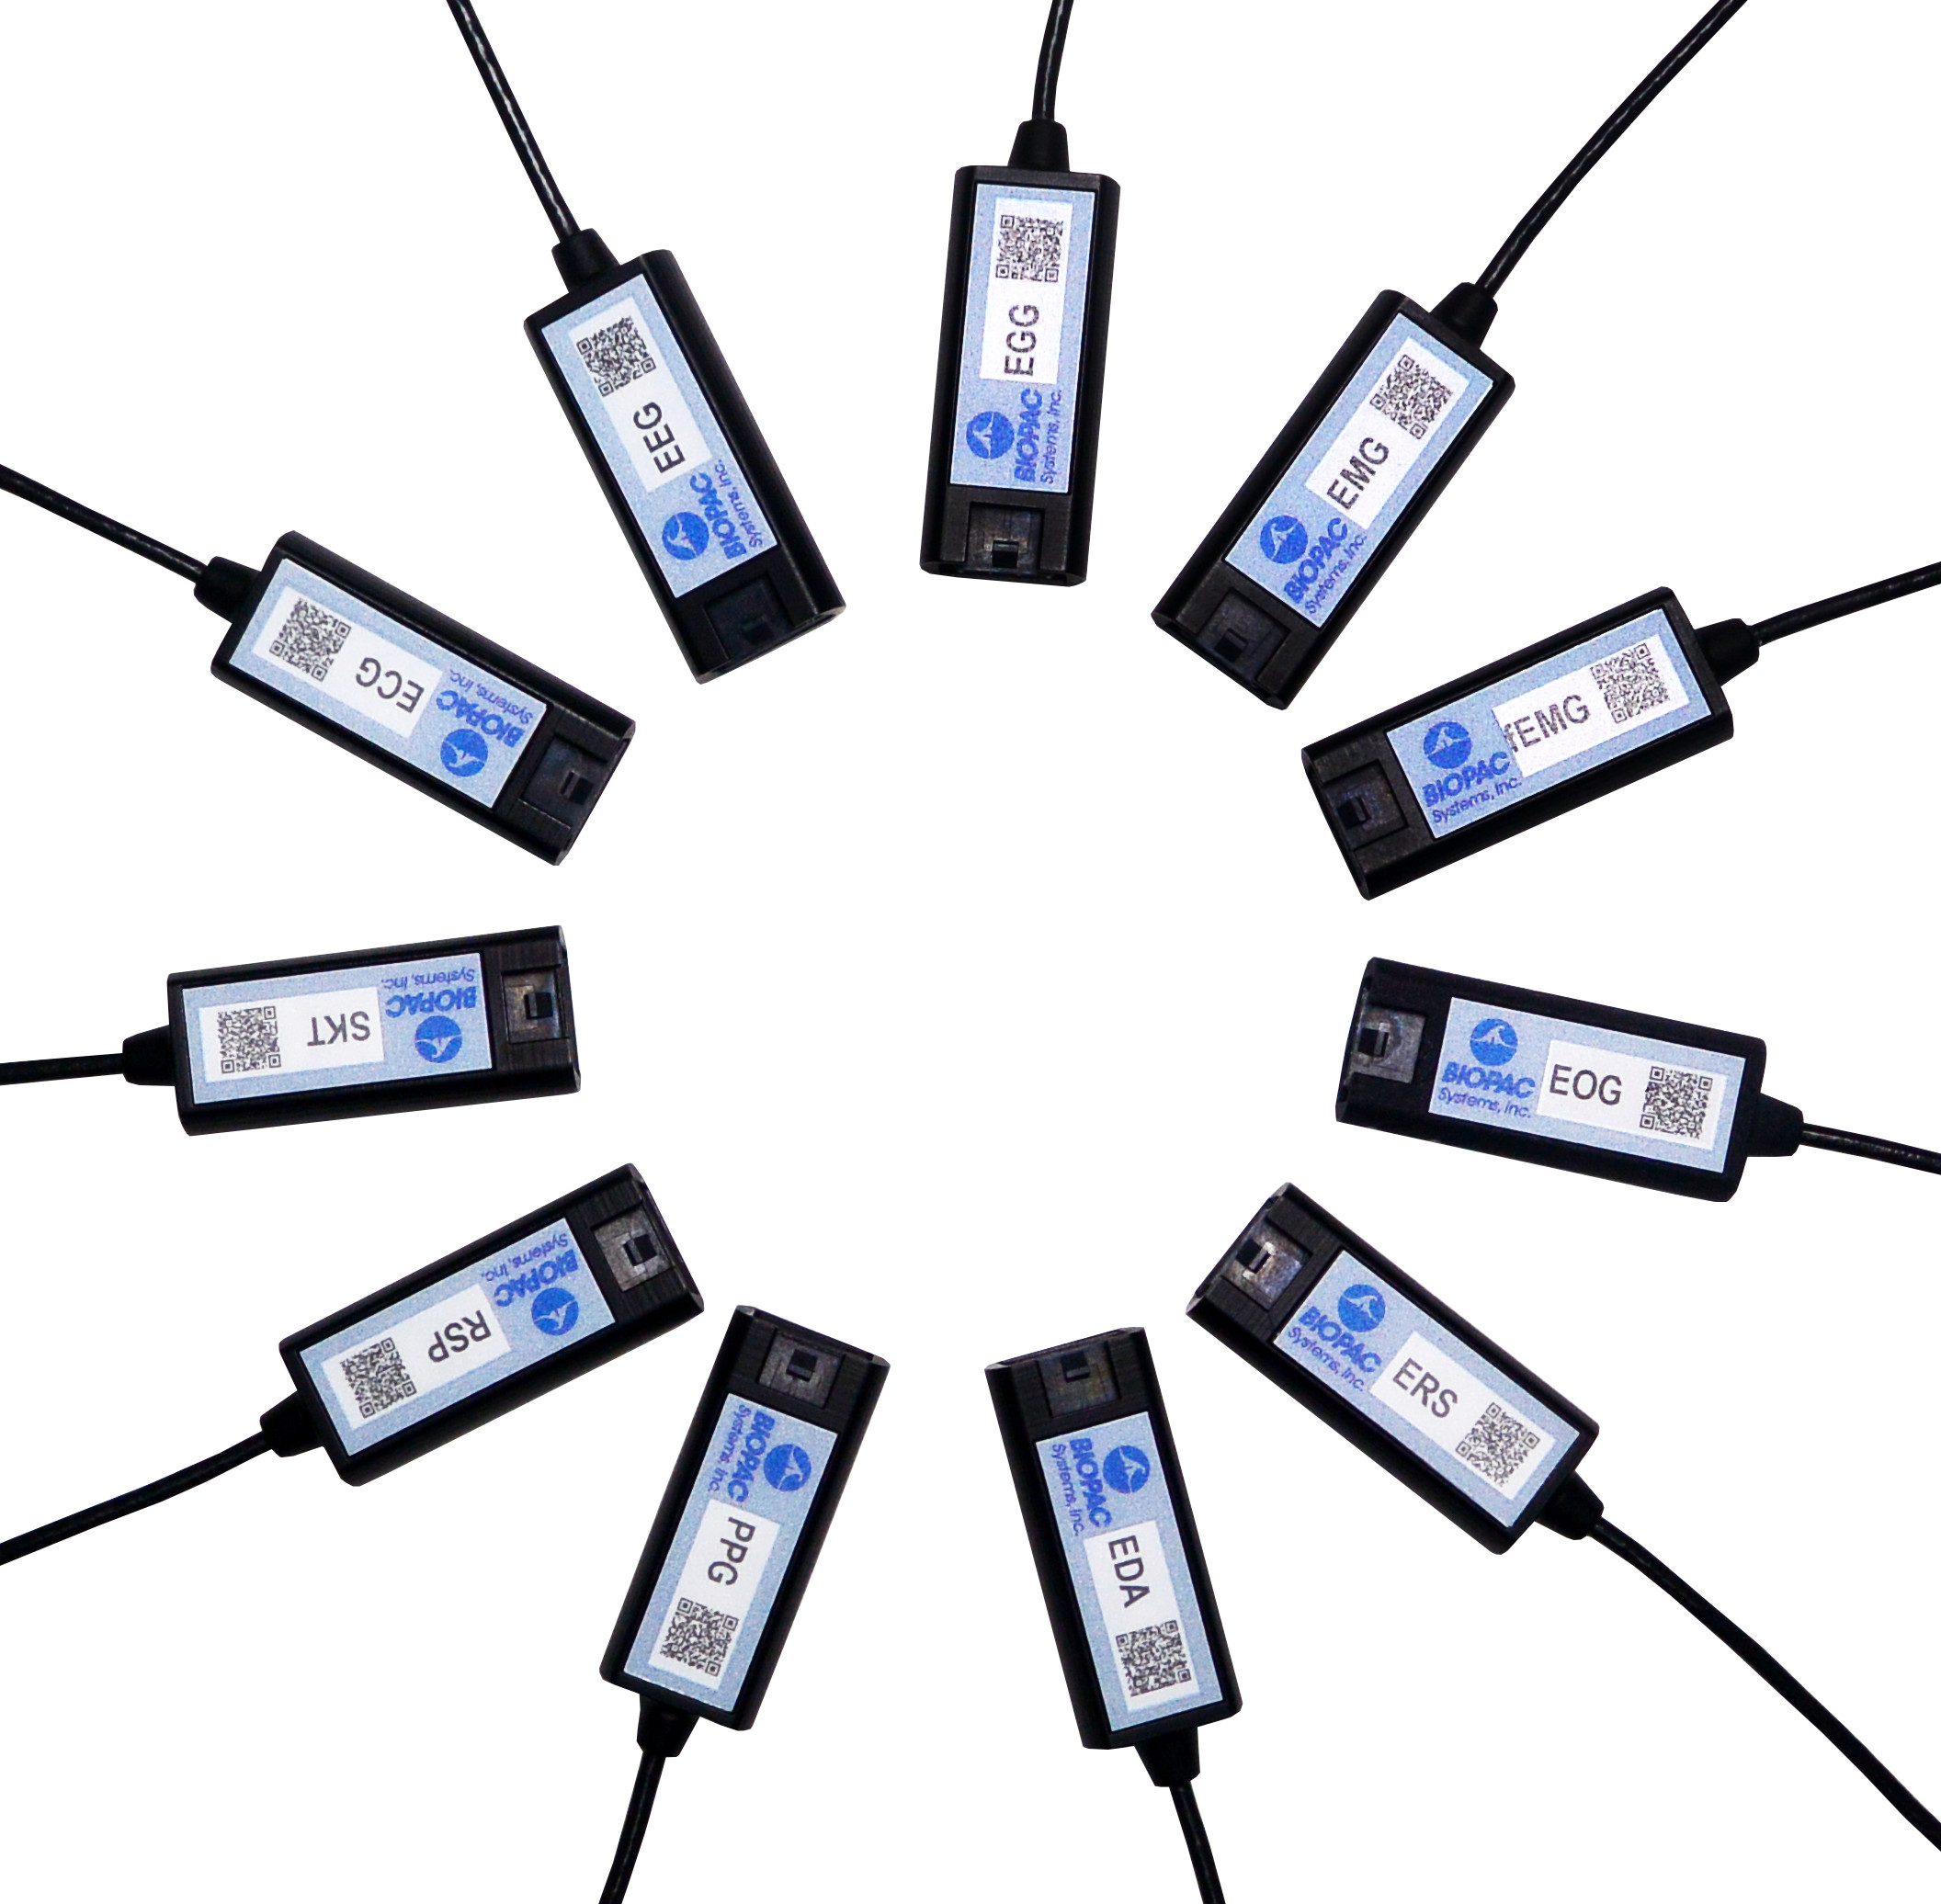
Smart Amplifiers are available for the following signals: ECG, EEG, EGG, EDA, RSP, PPG, ERS, EOG, SKT, EMG and new fEMG (facial and small muscle).

Significantly smaller footprint, simple setup, unparalleled user comfort, superlative data quality, compatible with previous-generation BIOPAC amplifiers (such as 100C and BioNomadix Series), portable and lightweight, Smart Amplifiers will be an epiphany for your research.

To see Smart Amplifiers in action, we invite you to watch our free on-demand webinar New Smart Technology for the Lab.

BIOPAC offers a wide array of wired and wireless equipment that can be used in your research. To find more information on solutions for recording and analyzing signals such as ECG, heart rate, respiration and more using any platforms mentioned in this blog post, you can visit the individual application pages on the BIOPAC website.

Small and Smaller – Untethered and Unfettered

Advancements in the engineering of data acquisition components have closely paralleled the microchip revolution. Ever-smaller form factors available in wireless transmission formats have resulted in a boon for researchers wishing to collect high-quality physiological data from participants in unfettered environments undreamed of a few years ago.

One of the linchpins of these cutting-edge systems is BIOPAC’s BioNomadix Series of wireless life science transmitters and receivers. BioNomadix modular receiver/amplifiers connect to the mother ship of the acclaimed MP160 System while the bite-sized matched transmitters attach to the participant, or comfortably nestle in a garment such as the BioNomadix BIOSHIRT. Unobtrusive specially designed leads connect to skin electrodes affixed to the participant, and BioNomadix units relying on transducers (such as respiration and skin temperature) offer equal convenience.

An even more streamlined system, the BioNomadix Smart Center, is also available. This system combines BioNomadix transmitters with the Smart Center all-in-one receiver and data acquisition unit. The soap bar-sized Smart Center connects to a computer USB port and supports up to 9 channels of physiological data from up to three wireless BioNomadix transmitters. (All BioNomadix transmitters are supported but connection is limited to three at a time.)

BioNomadix transmitters are dual-channel or dual-signal, with the exception of the Accelerometer, which supports three channels (X, Y, and Z axes).

Acquired signals are of extremely high quality and clarity and are rendered in AcqKnowledge Research Software. BioNomadix systems are available for fourteen body signal types, including ECG, RSP, PPG, EDA, EOG, EEG, EMG, EGG, ACCL, SKT, Goniometer, Dynamometer with EMG, Cardiac Output, and Heel-Toe Strike.

What does all of this mean to the researcher? Nearly unlimited freedom of movement at distances up to 10 meters from the receiver units—opening up new avenues of research and even new vistas in artistic expression.

A stunning and eclectic example of the latter can be taken from this brief performance by Compagnie Linga, a contemporary dance company based in Lausanne, Switzerland. Dancers wore BioNomadix accelerometers to record transmit their movements in real time, which were then digitally rendered in sound. The result is a tableau of dance and self-generated musical accompaniment, an artscape created from the firings of human physiology.

For more information about BioNomadix, please see:

BioNomadix Wireless Amplifiers

BioNomadix Wireless EMG for Neuro-Controlled Prosthetic

Free On-Demand Webinar – Recording Great Data from Exercising and Mobile Subjects

BIOPAC offers a wide array of wired and wireless equipment that can be used in your research. To find more information on solutions for recording and analyzing signals such as ECG, heart rate, respiration and more using any platforms mentioned in this blog post, you can visit the individual application pages on the BIOPAC website.

The Face of Facial Expression Analysis

Say you’re in a situation where it behooves you to keep a poker face. At an auto dealership negotiating a price on the new car of your dreams, or sitting across from your boss trying to make a case for a promotion. Your heart is pounding, sweat is forming in the crevasses of your palms, yet you need to keep yourself in check and not betray your excitement or apprehension. How skilled are we at masking emotions really? Emotions affect everyone in daily life, and play a key role in non-verbal communication. They are essential to understanding human behavior. A growing area of research is geared toward classifying and analyzing human emotions for a variety of studies, and methods for acquiring this data have become increasingly reliable and sophisticated. How do these studies work, and how is something as amorphous as the smallest twitch of a facial expression accurately recorded?

Facial “emotion reading” software such as FaceReader can detect minute variations in facial expressions by analyzing key points on the face (over 500) and has been “trained” with more than 10,000 manually annotated images to enhance facial modeling accuracy. Using this vast classification library, the input is distilled into six basic or universal emotions, (happy, sad, angry, surprised, scared, disgusted, or neutral.) Facial expression data is non-invasively gathered in real-time via a still or video camera, so no electrodes or leads are necessary.

But these refinements are more than skin deep. Additional tools for further quantifying facial expression data are commonly available. “Action Units” is the term used to describe individual or group facial muscle activity. The FaceReader Action Units add-on module allows automatic analysis of a selection of 20 common Action Units (such as raising of cheeks, wrinkling of nose, dimpling, and lip tightening) to measure affective attitudes (such as interest, boredom, and confusion).

Facial expressions can be visualized as bar graphs, in a pie chart, and as a continuous signal. Using FaceReader integrated with AcqKnowledge software and the MP160 System extends the functionality. Not only is the data automatically synchronized with other signals (ECG, fEMG, EDA, etc.,) but the recorded facial video can be monitored in the FaceReader display for real-time feedback.

Perhaps with a bit of practice, you can pull off that promotion and be able to afford that new car without tipping your hand!

For more information about FaceReader Software, watch the free On-Demand Webinar, “Using Facial Expressions to Understand Behavior” with BIOPAC CEO Frazer Findlay.


BIOPAC offers a wide array of wired and wireless equipment that can be used in your research. To find more information on solutions for recording and analyzing signals such as ECG, heart rate, respiration and more using any platforms mentioned in this blog post, you can visit the individual application pages on the BIOPAC website.

error: Content is protected !!